matplotlib에서 legend 함수는 그래프의 범례를 보여줍니다.
legend의 loc값에 따라 범례의 위치가 달라지는데 오늘은 범례의 위치를 확인해보겠습니다.
import matplotlib.pyplot as plt

ys = [10 * x for x in range(4)]

plt.subplots(3, 3, figsize=(8, 8))
for i in range(1, 10):
    plt.subplot(3, 3, i)
    plt.plot(ys, label='legend='+str(i))
    plt.legend(loc=i)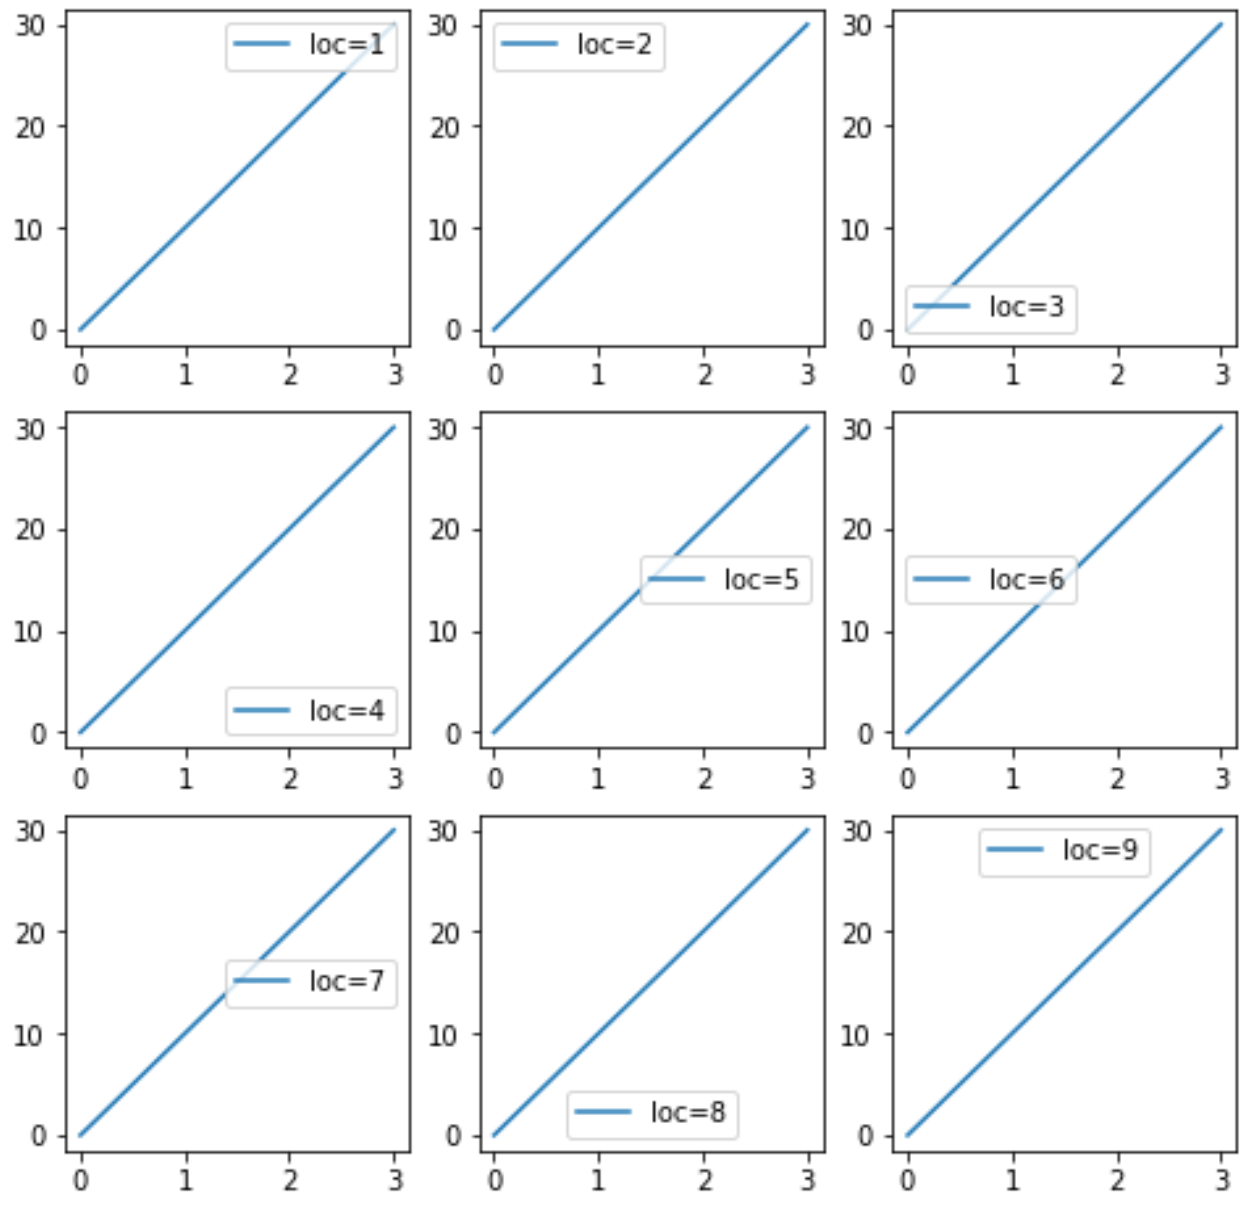
loc = 10인 경우,
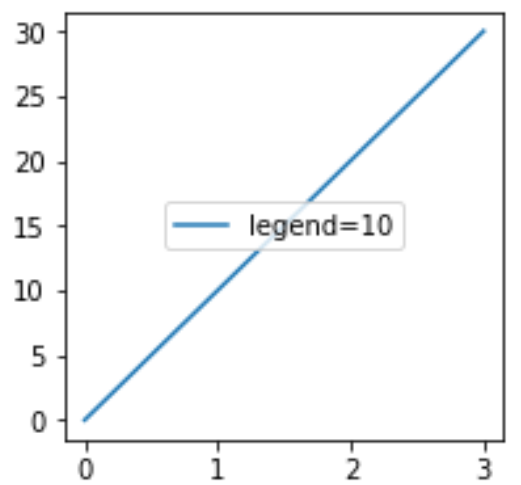
위치를 정리해보면 다음과 같습니다.
| 2 | 9 | 1 |
| 6 | 10 | 5, 7 |
| 3 | 8 | 4 |
loc 인자에 숫자를 넘겨주는 방법 외에도, 문자열을 넘겨주어 위치를 선정하는 방법도 있습니다.
| 번호 | 문자열 |
| 0 | best |
| 1 | upper right |
| 2 | upper left |
| 3 | lower left |
| 4 | lower right |
| 5 | right |
| 6 | center left |
| 7 | center right |
| 8 | lower center |
| 9 | upper center |
| 10 | center |
'Python > Syntax' 카테고리의 다른 글
| [Excel] utf-8 csv파일 한글 깨짐 해결법 (0) | 2022.07.08 |
|---|---|
| [Matplotlib] 그래프 색 지정 (0) | 2022.07.08 |
| [Pandas] DataFrame에서 랜덤한 행 추출 (0) | 2022.06.09 |
| [Pandas] 행 인덱스를 제외하고 DataFrame을 csv 파일로 저장 (1) | 2022.06.08 |
| [JupyterNoteBook] 다른 주피터 노트북으로 셀을 복사 (0) | 2022.06.08 |